© Joe Kiesecker
Kennedy, CM, Oakleaf JR, Theobald DM, Baruch‐Mordo S, Kiesecker J, (2018) Managing the middle: A shift in conservation priorities based on the global human modification gradient. Global Change Biology 00:1–16. https://doi.org/10.1111/gcb.14549
Global Human Modification
MAPPING CURRENT CONDITION OF LANDSCAPES
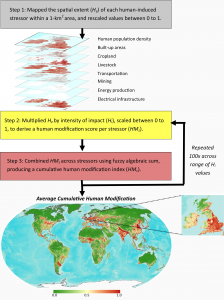
Designing conservation strategies in the age of humans, or the Anthropocene, requires an up-to-date and comprehensive understanding of current condition of the world’s landscapes. The Nature Conservancy in collaboration with Conservation Science Partners recently produced the Global Human Modification map (HM) based on modeling how much (spatial extent) and at what magnitude (intensity) 13 different human activities impact terrestrial lands, ecoregions, and biomes.
The HM is an intuitive gradient ranging from 0 (no modification) to 1 (fully modified). It reflects the proportion of a landscape modified by human settlement, agriculture, transportation, mining, energy production, and electrical infrastructure. Relative to previous efforts, the HM covers a greater number of human activities at a finer scale, and input data are more recent (reflecting the year 2016) and capture the rapid changes over the past decade.
The HM reveals that 95% of the Earth’s surface has some indication of human modification, and 84% has multiple human impacts. Most of the world is in a state of intermediate modification and fall within critical land use thresholds, with 52% of ecoregions and 48% of countries considered moderately modified. Given their vulnerability to further land change, moderately modified regions warrant conservation attention and require proactive spatial planning to maintain biodiversity and ecosystem function before environmental values are lost.

